
Tableau is a leading business intelligence and data visualization platform renowned for its ability to turn data into interactive and shareable dashboards. Designed to help organizations make data-driven decisions, Tableau offers powerful tools for analyzing, visualizing, and understanding complex data sets. With its intuitive drag-and-drop interface and robust analytical capabilities, Tableau empowers users across various industries to gain insights, track performance, and drive strategic actions.
Tableau is a comprehensive analytics platform that enables users to connect to a wide range of data sources, visualize data, and share insights seamlessly. The platform features an intuitive interface that allows users to create interactive dashboards, generate detailed reports, and perform in-depth data analysis with minimal technical expertise. Tableau supports various deployment options, including desktop, server, and cloud-based solutions, providing flexibility to meet diverse organizational needs. Its advanced visualization capabilities include a variety of chart types, maps, and graphs, allowing users to uncover trends, patterns, and correlations within their data.
Data Visualization and Reporting
Tableau excels in transforming complex data into clear, actionable visualizations. The platform’s drag-and-drop interface simplifies the process of creating interactive dashboards and reports, making it accessible to users of all skill levels. Tableau’s rich visualization options enable users to build detailed charts, graphs, and maps that highlight key performance indicators (KPIs) and business metrics. The platform’s ability to handle large data sets and perform real-time data analysis ensures that users can explore and interpret data effectively. Tableau’s sharing capabilities allow teams to collaborate on insights and make data-driven decisions collectively.
Analytics and Insights
Tableau offers advanced analytics tools that facilitate in-depth data exploration and insight generation. Users can perform complex calculations, create custom metrics, and apply statistical models to their data. Tableau’s integration with R and Python enables the incorporation of advanced analytics and machine learning algorithms into dashboards and reports. The platform’s interactive features, such as drill-down and filtering, allow users to explore data at various levels of granularity. Tableau’s support for natural language processing (NLP) further enhances its analytical capabilities, enabling users to ask questions about their data and receive visual responses.
At Veltrix, we are dedicated to helping businesses maximize the potential of Tableau to drive insightful decision-making. Our team of experts offers comprehensive services including Tableau implementation, dashboard and report design, and data integration. We assist in setting up and configuring Tableau environments, creating customized visualizations and reports, and integrating Tableau with other data systems. With Veltrix’s support, you can unlock the full power of your data, enhance reporting capabilities, and foster a data-driven culture within your organization.
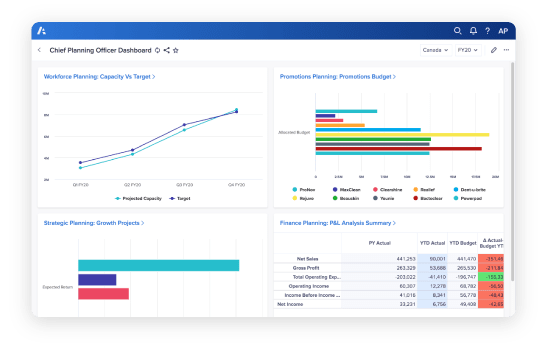
Tableau provides tailored solutions for various departments, enhancing their ability to analyze and visualize data effectively:
HR & Workforce: HR departments use Tableau to visualize workforce metrics, track employee performance, and analyze recruitment and retention data. The platform supports monitoring key HR indicators such as turnover rates, employee engagement, and diversity metrics.
Finance: Finance teams leverage Tableau for financial reporting, performance analysis, and budgeting. The platform helps in visualizing financial data, tracking revenue and expenses, and performing variance analysis to support strategic financial planning.
Supply Chain: Tableau enhances supply chain management by providing insights into inventory levels, supplier performance, and logistics. It supports visualizing key supply chain metrics, optimizing inventory management, and identifying potential supply chain disruptions.
Sales & Marketing: Sales and marketing teams benefit from Tableau’s capabilities in tracking sales performance, analyzing marketing campaigns, and visualizing customer data. The platform enables dynamic sales forecasting, campaign effectiveness analysis, and customer segmentation.
Tableau is a business intelligence and data visualization platform that enables users to create interactive dashboards, generate reports, and analyze data to uncover actionable insights.
Core features include interactive dashboards, a drag-and-drop interface, real-time data analysis, and advanced visualization options.
Tableau provides a wide range of visualization options, including charts, graphs, and maps, to help users transform complex data into clear, actionable insights.
Advanced capabilities include support for R and Python integration, custom metrics, statistical modeling, and natural language processing (NLP).
Tableau integrates with various data sources, including cloud-based, on-premises, and big data systems, providing a unified view of business data.